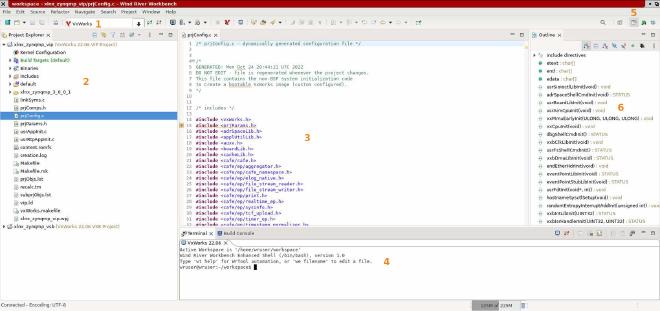
Workbench is an integrated development environment (IDE) that supports the construction of VxWorks projects.
Learning Objectives #
After this section you will be able to:
- Describe what Workbench 4 is
- Describe how Workbench relates to the Eclipse IDE
- Navigate the layout of workbench
What is Workbench 4 #
Workbench 4 sits at the top of the ecosystem, bridging the integrated hardware, middleware, and software to develop VxWork projects.
It has a variety of tools in its arsenal:
- Compilers
- Project facilities
- Static debugging and analysis
- Dynamic debugging and analysis
- Target simulation
Wind River Studio is another great option for working with and implementing VxWorks projects.Wind River Studio- The Platform For Intelligent Edge Systems
Workbench 4 is a Wind River product, but it runs off of a common platform.
Eclipse Framework #
Workbench is based on the Eclipse platform. This is a popular IDE, with many intuitive design choices, making it easy to pick up and navigate. Eclipse is an open platform for tool integration that leverages open-source licensing and a community of tool developers. Workbench provides some powerful features from Eclipse, these include:
- An open-source, standards-based framework for development tools integration
- A graphical user interface (GUI) framework and tool integration
- Open access, extensibility, and standardization
- Plug-in extensions and support
- C/C++ and Java development tools

- Connection menu
This menu allows for you to set up connections with a target. This can be a real target or a simulator.
- Project Explorer
In the Project Explorer you will find all your project files that are saved in workbench.
- Development Window
In this view, you can open and edit different files in your VxWorks project. This is the main workspace where you will spend a majority of your time in development.
- Terminal
The terminal will allow you to execute commands and connect to the shell.
- Perspectives
These are the perspective tabs. Workbench comes with a few premade ones.
Some include:
- System Development
- System Viewer
- Debug
- Analysis
- Docker Tooling
You can also access the perspectives by going to “Window > Perspective” on the tool bar.
- Utility Window
This window contains different utility widgets. You can open specific ones, but most perspectives have certain widgets open by default.
Some include:
- Breakpoints
- Debug
- Docker Containers
- Outline
